
Millburn (Short Hills), NJ
Quick Facts
Everything you need to know about one of Northern New Jersey's most sought-after communities.
County: Essex County, NJ
Zip Codes: 07041 (Millburn) · 07078 (Short Hills)
Combined Population: ~21,710
Median Home Price — Millburn: $1.85M+
Median Home Price — Short Hills: $2.1M+
Average Days on Market: ~27–40 days
Median Household Income: $250,000+
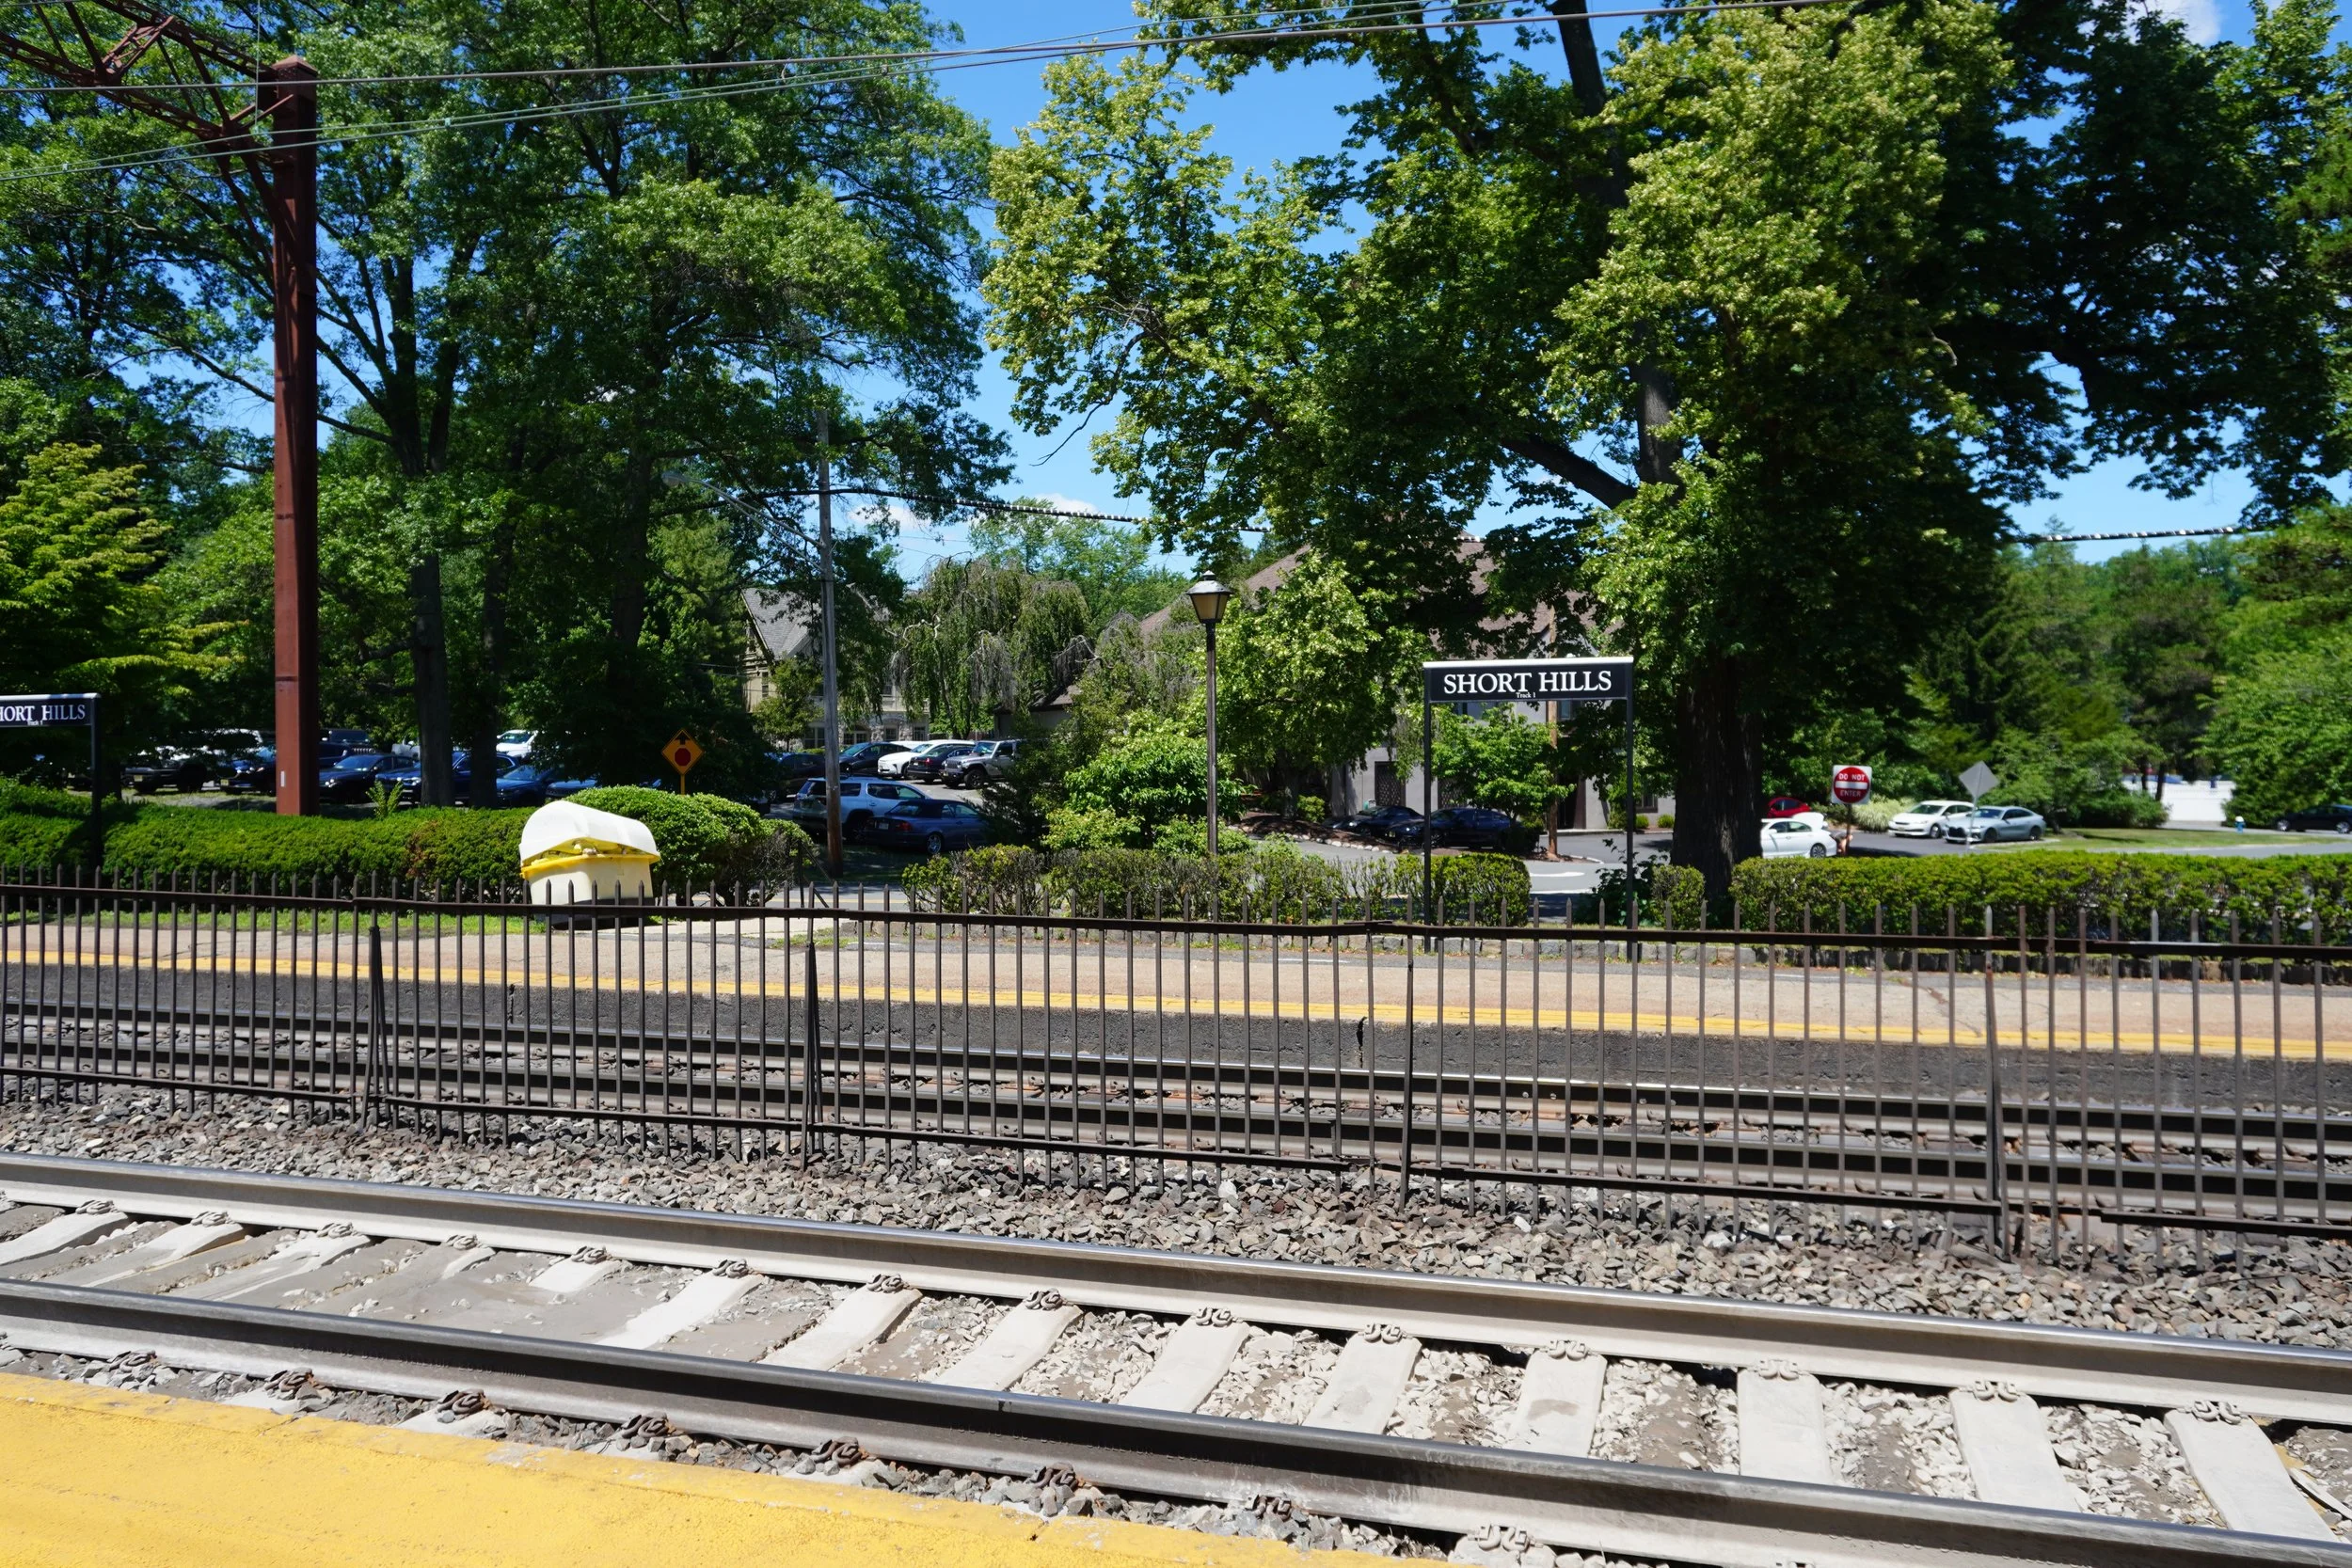
Train to NYC Penn Station: ~30 minutes via Morris & Essex Line
Homes For Sale in Millburn & Short Hills
Market Stats
Let’s Discuss Your Home’s Value in Today’s Market
Whether you are ready to list or just beginning to explore a move, the first step is an accurate market evaluation.
Our team provides the local data and strategic planning needed to achieve a premium result for your property.
Living in Millburn & Short Hills
Millburn Township is a suburban municipality in Essex County comprising two distinct and celebrated communities — the walkable, historic village of Millburn and the elegant, estate-lined neighborhood of Short Hills.
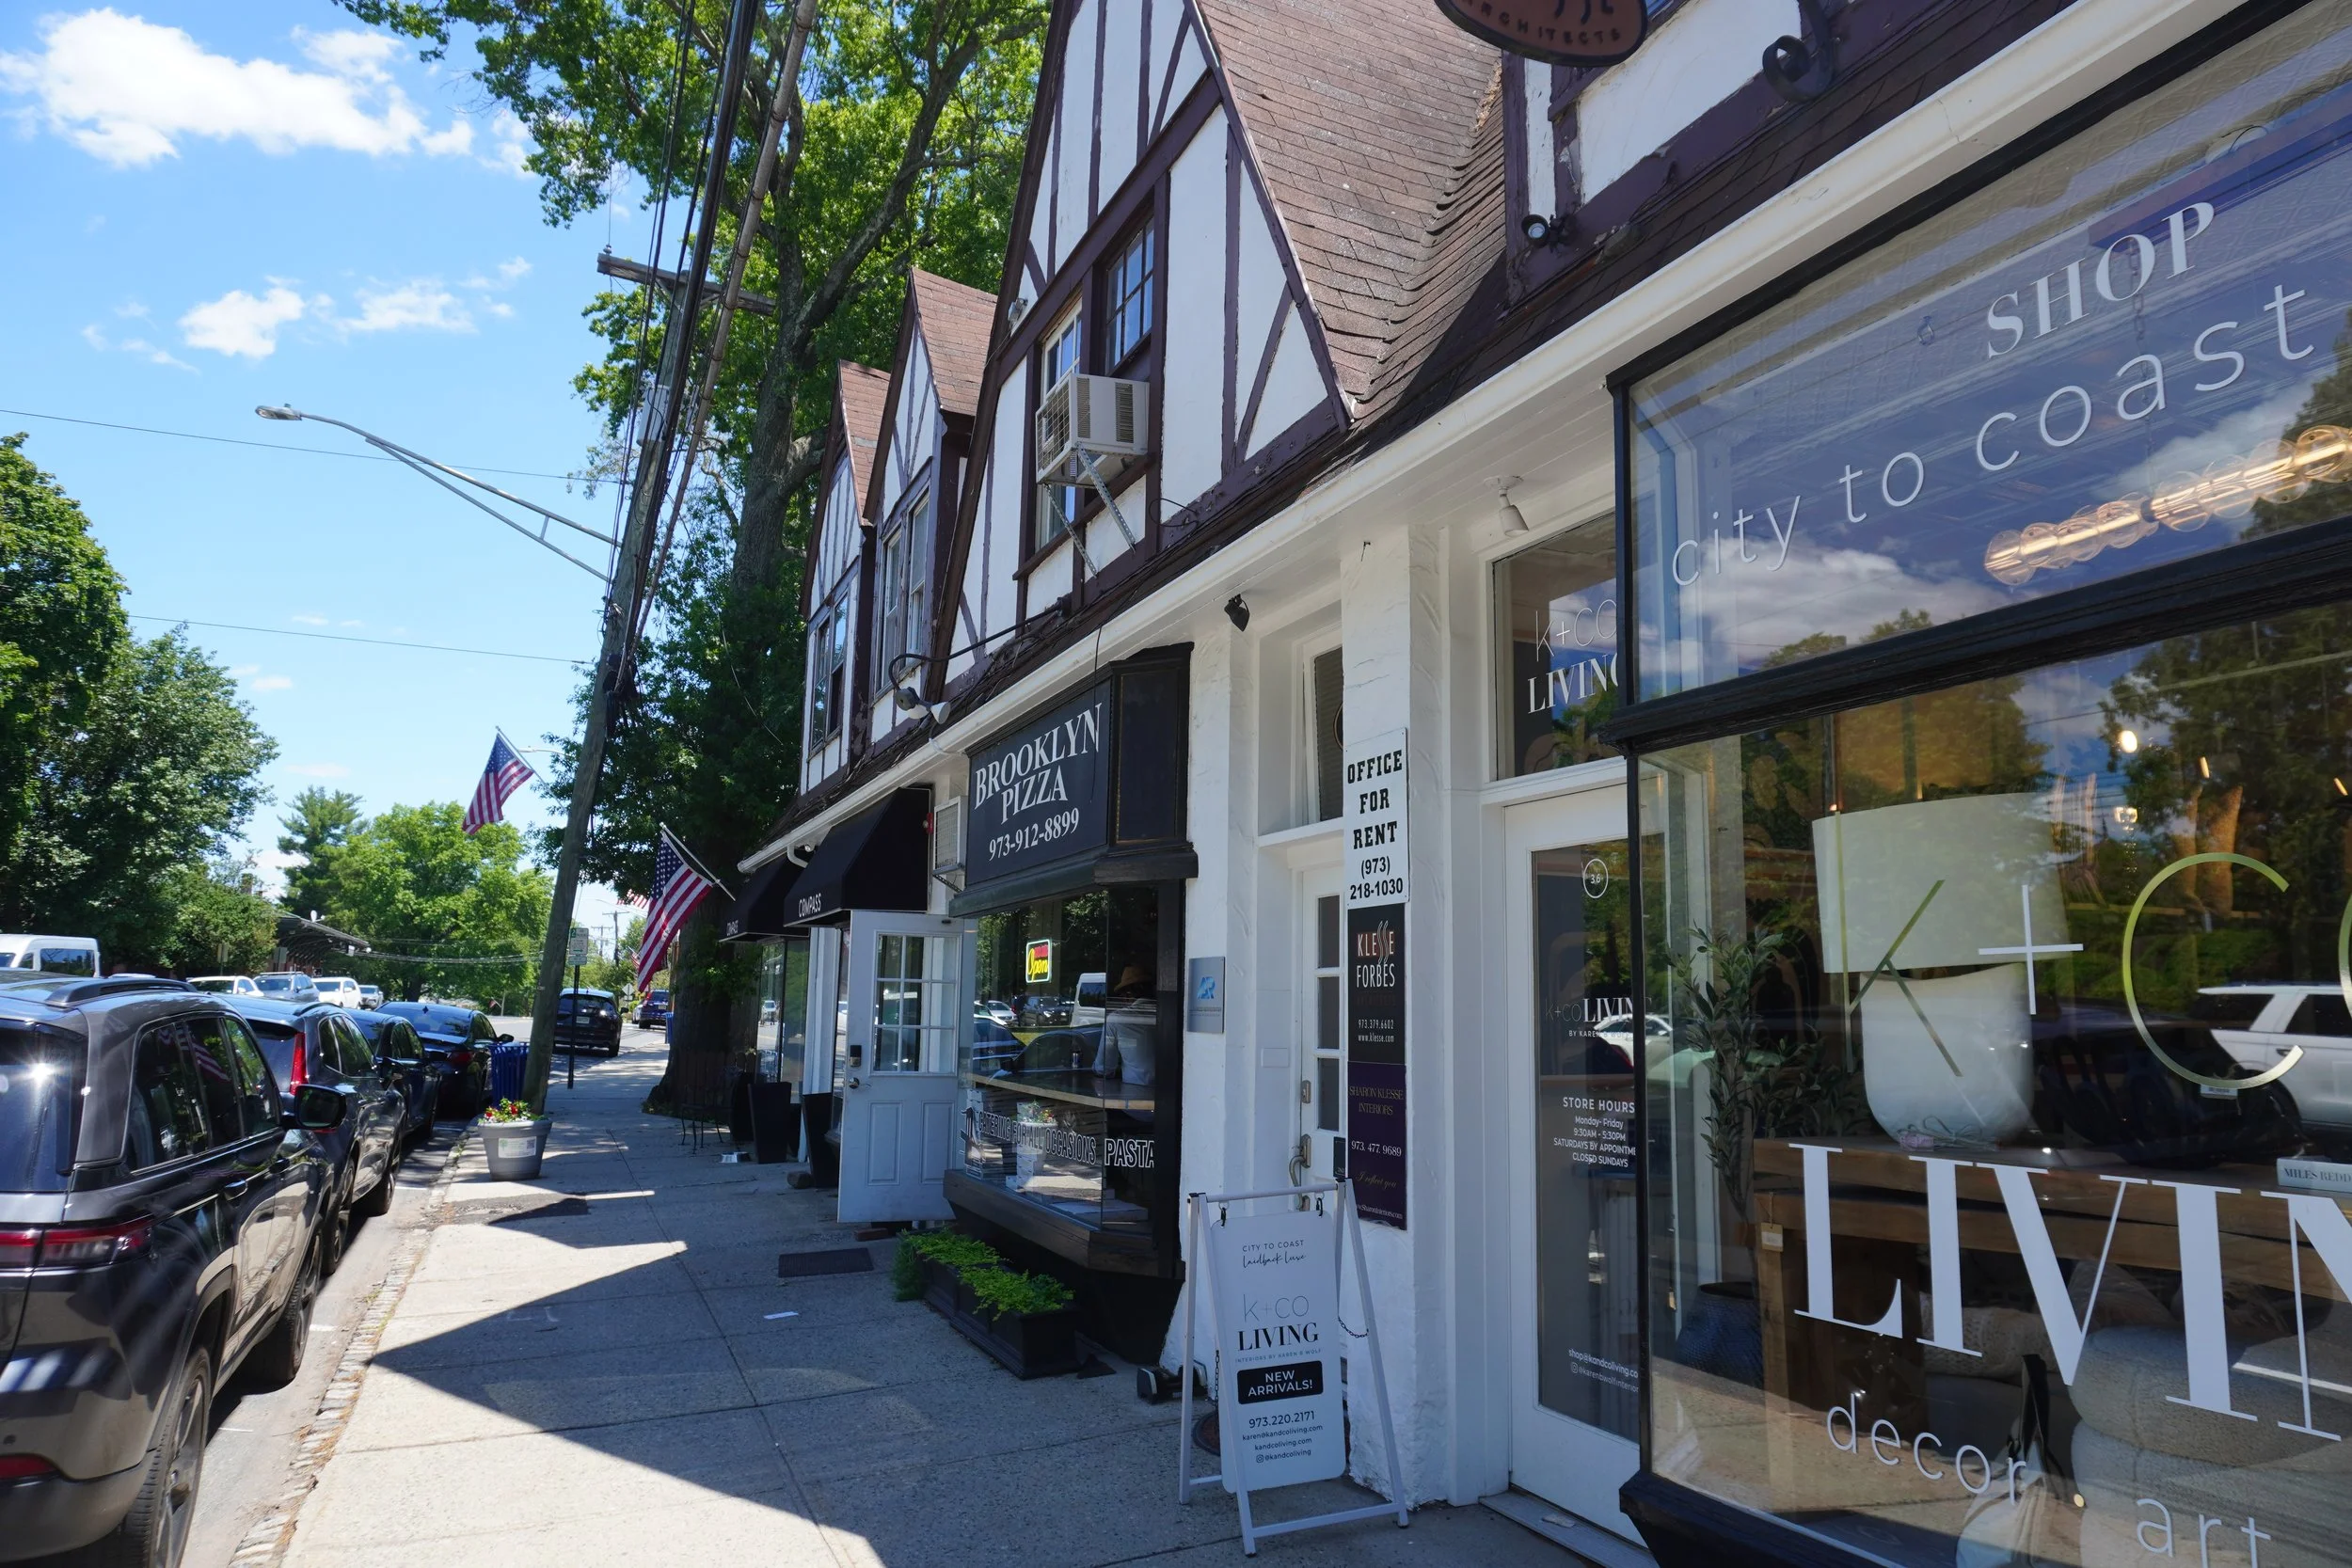
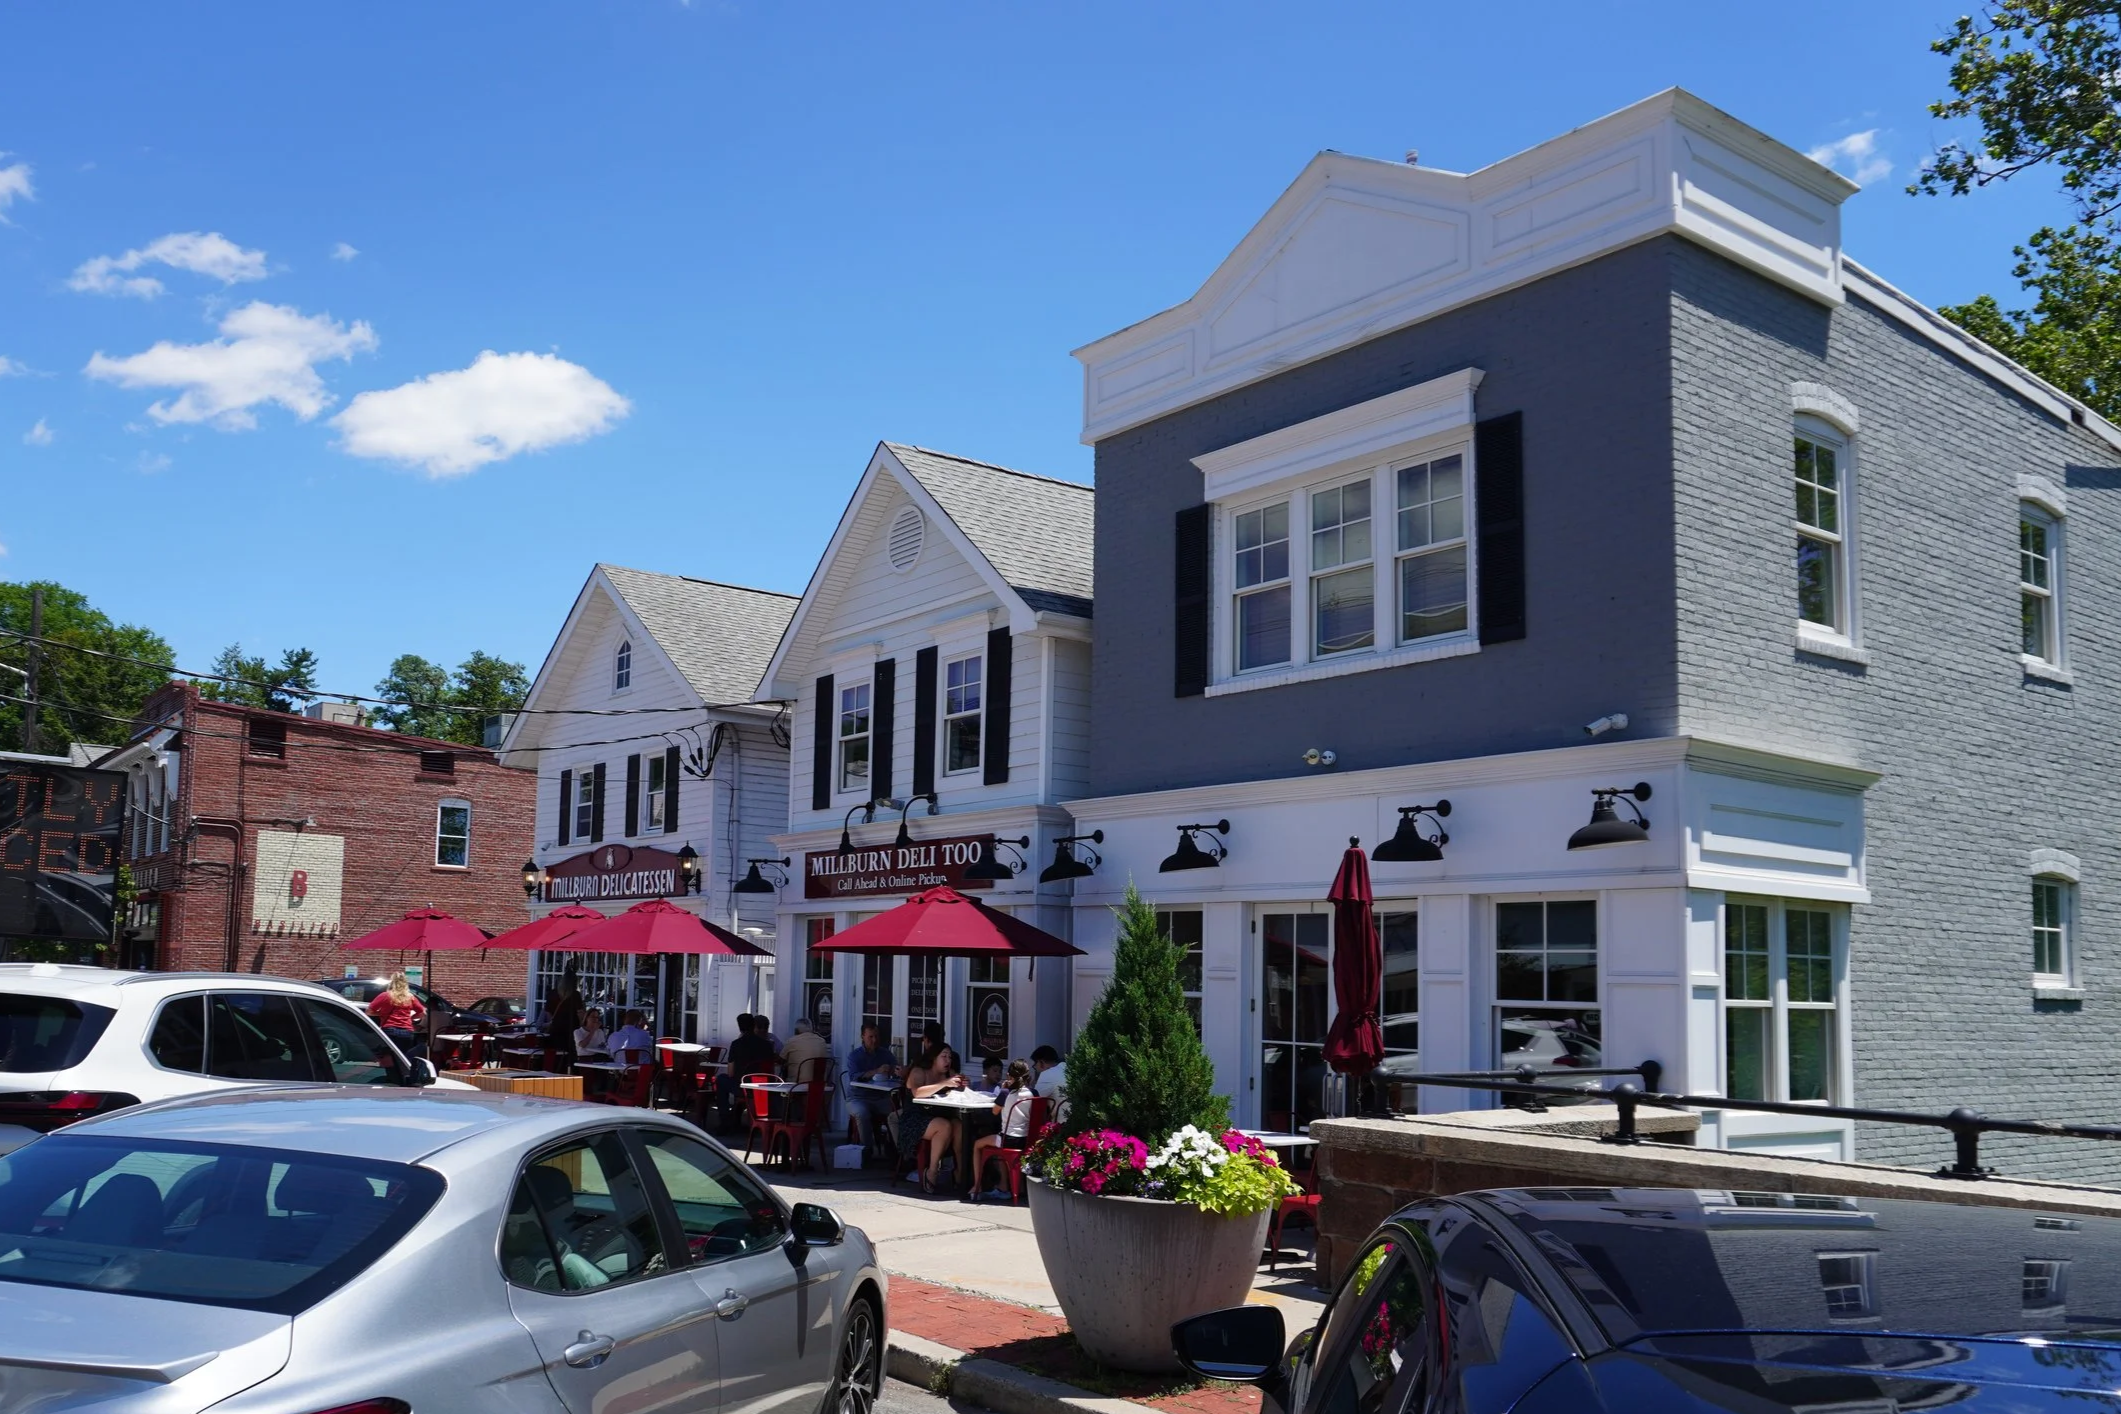
Millburn's charming downtown, anchored by the West Branch of the Rahway River, offers a vibrant mix of boutique shops, acclaimed restaurants, and cultural institutions — most notably the Paper Mill Playhouse, one of the nation's most prestigious regional theaters.
Short Hills is something altogether different. Designed by Stewart Hartshorn in the late 1800s as a carefully planned community that blended homes with nature, Short Hills was one of America's first commuter suburbs — and that original vision of gracious living surrounded by natural beauty still defines it today. Its tree-lined streets, stately estates, and nationally recognized school district make it one of the most coveted addresses in all of New Jersey.
Together, Millburn and Short Hills consistently rank among the most expensive and desirable markets in the state — with a median household income exceeding $250,000 and a public school district ranked among the top three in New Jersey.
Why People Love Living in Millburn & Short Hills!
-

Downtown & Dining
Millburn's Main Street is a vibrant and walkable downtown destination — lined with chef-driven restaurants, boutique retailers, and local establishments that draw residents from across Essex County. The community pool, par-3 golf course, and recreational complex add to the everyday quality of life that makes Millburn so livable.
-

Arts & Culture
The Paper Mill Playhouse, located in Millburn, is one of America's most acclaimed regional theaters — producing Broadway-caliber performances year round and drawing audiences from throughout the tri-state area. It is one of the defining cultural institutions of Northern New Jersey.
-
Outdoor & Recreation
South Mountain Reservation covers over 2,000 acres and was designed by the Olmsted Brothers in 1895 — offering miles of hiking trails, picnic areas, and natural beauty directly accessible from both Millburn and Short Hills. The Cora Hartshorn Arboretum in Short Hills provides an additional sanctuary of nature and seasonal programming for residents.
-

Community & Character
The Mall at Short Hills — one of the most renowned luxury shopping destinations in the United States — anchors Short Hills as a destination in its own right. Beyond retail, both communities are defined by deep civic engagement, outstanding schools, and a genuine sense of neighborhood pride that has endured for generations.
Millburn Schools
Both Millburn and Short Hills are served by the Millburn Township School District — consistently ranked among the top three public school districts in New Jersey, offering PreK through 12th grade education across eight schools.
Elementary Schools — Grades PreK–4
Deerfield Elementary School · 26 Troy Lane, Short Hills
Glenwood Elementary School · 325 Taylor Road South, Short Hills
Hartshorn Elementary School · 400 Hartshorn Drive, Short Hills · (973) 379-7550
South Mountain School · 2 Southern Slope Drive, Millburn · (973) 921-1394
Wyoming Elementary School · 55 Myrtle Avenue, Millburn · (973) 761-1619
Grade 5
Washington School · 71 Spring Street, Millburn · (973) 218-7500
Middle School — Grades 6–8
Millburn Middle School · 25 Old Short Hills Road, Millburn · (973) 379-2600
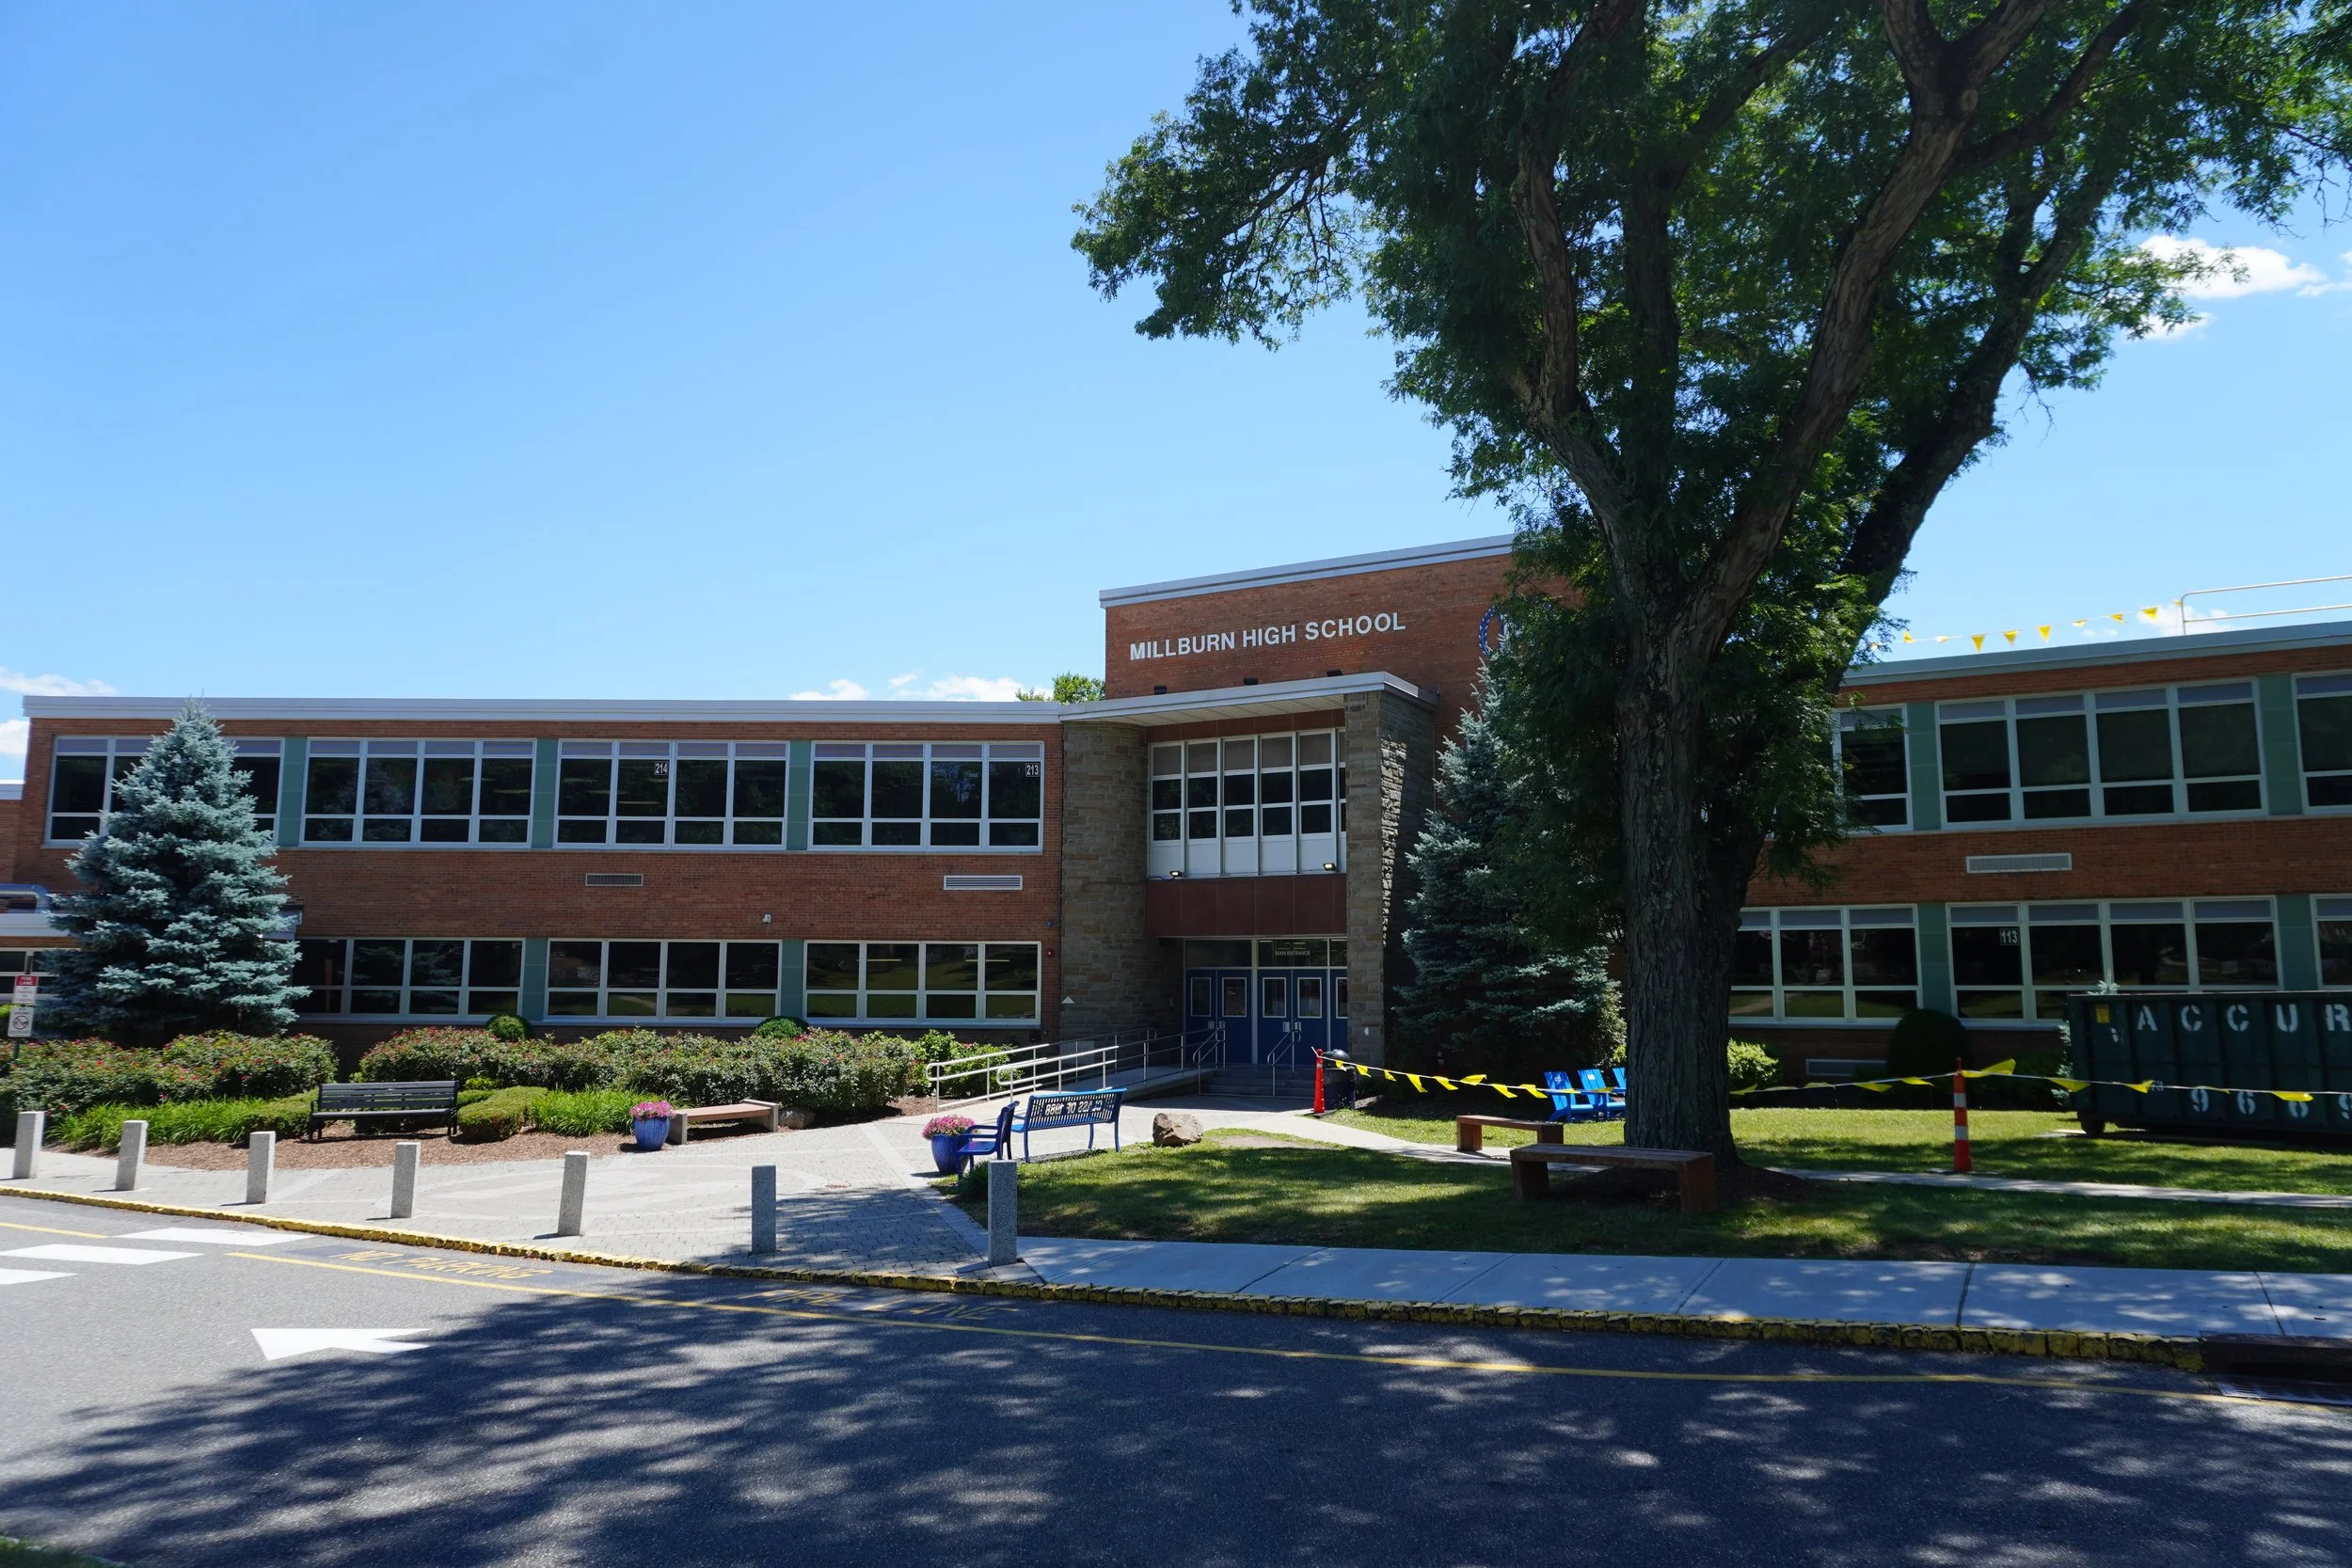
High School — Grades 9–12
Millburn High School · 462 Millburn Avenue, Millburn · (973) 564-7130
For more information visit the Official Millburn Township School District Website
Frequently Asked Questions
Q: What is the average home price in Millburn and Short Hills, NJ? Millburn and Short Hills represent two of the most premium real estate markets in New Jersey. The median home price in Millburn is approximately $1.85M, while Short Hills commands a median of $2.1M or higher — reflecting the exceptional quality of homes, schools, and lifestyle this community consistently delivers.
Q: What is the difference between Millburn and Short Hills, NJ? Millburn is the township's walkable village center — with a charming downtown, train station, and historic character. Short Hills is an unincorporated community within Millburn Township known for its stately estates, planned neighborhood design, and some of the most elegant residential streets in New Jersey. Both share the same outstanding school district and community character.
Q: How long does it take to sell a home in Millburn and Short Hills, NJ? Homes in Millburn and Short Hills typically sell within 27–40 days on market. Properties priced correctly and presented well — particularly in the $1M–$2M range — regularly receive multiple offers and close above asking price.
Q: How far is Millburn and Short Hills, NJ from New York City? Millburn and Short Hills are approximately 20 miles west of Manhattan. Via NJ Transit's Morris & Essex Line, commuters can reach New York Penn Station in approximately 30 minutes — one of the fastest commutes in the region.
Q: Who is the best realtor in Millburn and Short Hills, NJ? Kim Cannon & Co is a trusted real estate team and listing agent serving Millburn, Short Hills, and the greater Morris & Essex Line communities — with over 25 years of local experience and $700M+ in closed sales.
Photo Disclaimer:
Photography on this page has been sourced from municipal and town websites for informational purposes only. All rights remain with their respective owners. If you are the copyright holder of any image and wish to have it removed or credited, please contact us at kim@kimcannon.com, and we will address your request promptly.